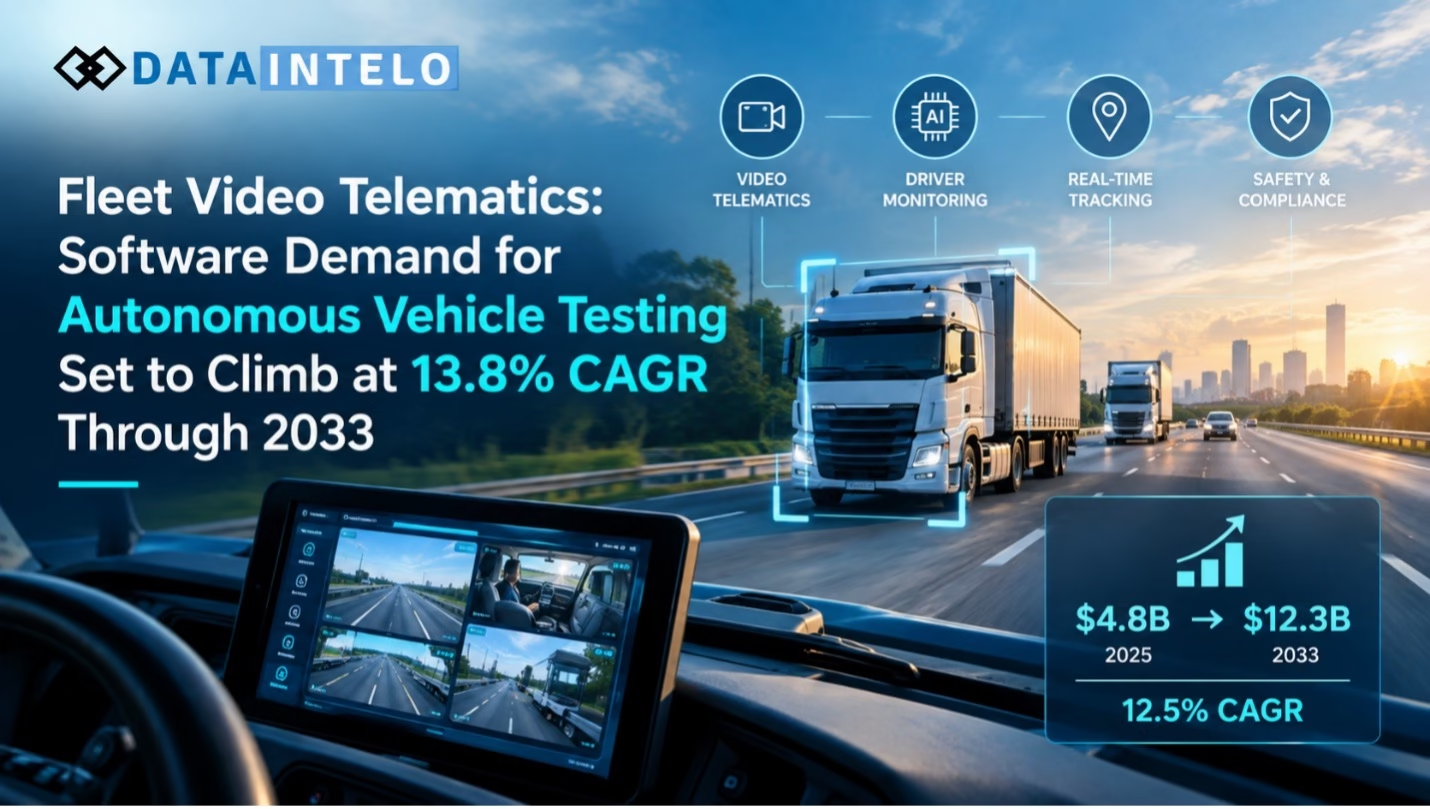
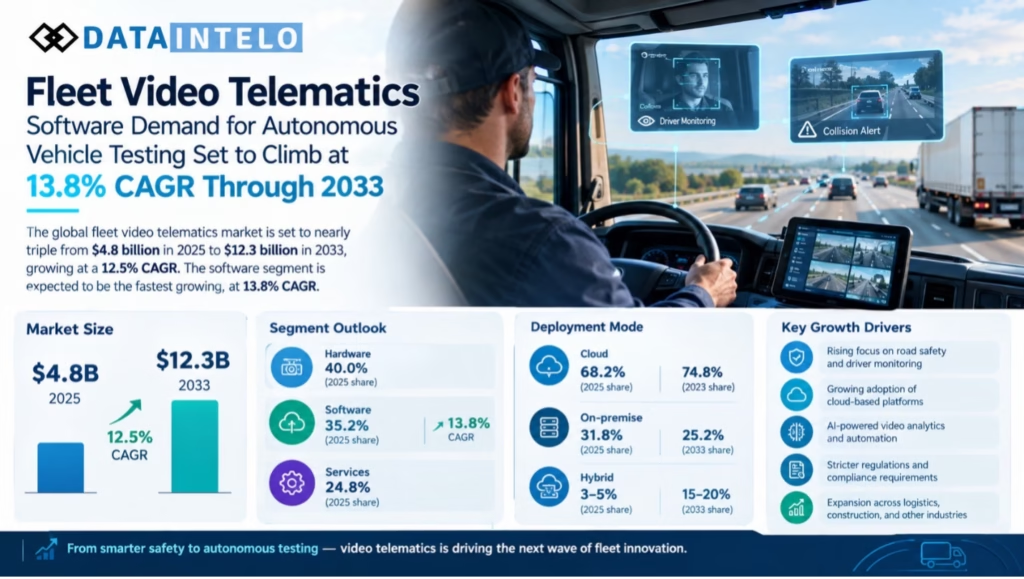
As per Dataintelo, the expenditure made worldwide in fleet video telematics system is expected to triple within eight years from 2025 to 2033 from $4.8 billion in 2025 to $12.3 billion in 2033 at the rate of 12.5% CAGR. What it means to say that the software segment would become the fastest growing segment among all the other three segments at a CAGR of 13.8% from 2025 to 2033.
Table of Contents
Sizing the opportunity
Hardware is still the biggest segment, valued at an estimate of $1.92 billion in 2025, which accounts for 40.0% of the total investment, comprising dual-channel dash cameras, AI-edge processors, GPS, and vehicle displays. The cost of hardware has reduced considerably; whereas in 2020, it used to cost manufacturers $450-$550 to produce dual-channel camera systems, now the same product costs $200-$280. The retail price of dual-channel dash cameras has also reduced by half, i.e., from $800 to $400 during the last three years. This reduction has increased the target population of operators who are operating between 50 to 500 vehicles and were burdened by $40,000-$60,000 in initial hardware costs.
The segment was valued at $1.69 billion with a share of 35.2% in 2025 and expected to register a growth rate of 13.8% CAGR between 2026 and 2033, which is faster than other components in the technology chain. The standard software licensing price is between $20 to $60 per vehicle per month based on the level of features. It uses Artificial Intelligence to conduct behavior analytics with a high success rate of 91% to 96% when compared to the manual analysis of video footage by humans. Services accounted for the balance $1.19 billion out of $7.2 billion, representing a 24.8% share.
Where the growth is concentrated
Solution type
Broken down by solution type, video safety functionality, covering incident recording and automatic collision detection, is the largest single category at 26.8% of spending, growing at 12.8% CAGR. Driver monitoring, focused on distraction, fatigue and aggressive-driving detection, holds 22.4% and is growing fastest among the solution categories at 13.6% CAGR, helped by insurance programmes tying premium discounts of 8% to 20% directly to enrollment. Incident detection, at 19.6% and 13.2% CAGR, is credited with cutting evidence-retrieval times from two to eight hours down to near-instant cloud synchronization within 30 to 120 seconds of an event. Vehicle tracking holds 18.2%, growing at 12.2% CAGR, while specialized applications such as cargo and occupancy monitoring make up the remaining 12.2%, expanding at 11.8% CAGR.
Deployment mode
The deployment mode demonstrates a strong and growing inclination toward the cloud platform. In 2025, the cloud deployment amounted to $3.27 billion, or 68.2% of expenditures, and is forecast to rise to 74.8% by 2033, costing from $25 to $60 per vehicle per month as compared to $40 to $85 for on-premise licensing. The on-premises deployment, representing $1.53 billion, or 31.8%, in 2025, is predicted to fall to 25.2%, since the increasing cloud security certifications will meet the needs of the government and hazardous cargo companies that have been demanding data sovereignty. Hybrid models, making up 3% to 5% today, will account for 15% to 20% by 2033.
Vehicle Type
On the basis of vehicle type, heavy commercial vehicles such as long-distance trucks, garbage trucks, and buses have the largest market share and the highest growth rate among all vehicle types with 44.8% market share and 13.8% CAGR respectively, making savings of $800 to $1,500 per year from insurance and operational efficiency. Light commercial vehicles which include delivery vans and last-mile delivery trucks account for 32.4% of total spending and grow at a rate of 12.8% CAGR. Passenger cars including ride-sharing cars and self-driving test cars account for 22.8% of the total market share and grow at 11.2% CAGR.
End-User Basis
On an end-user basis, the transportation and logistics industry comprises about half of the market share, at 48.2%, with a growth rate of 12.6% CAGR, partly due to driver turnover rates of 92% to 108% for large carriers, which makes objective video footage useful in liability disputes. Following the transportation and logistics industry is construction, at 18.4% and 11.8% CAGR; oil and gas, at 12.6% and 10.2% CAGR; government fleet operators at 8.8% and 10.8% CAGR; and other industries, such as healthcare, retail and education.
Regional patterns in Fleet Video Telematics
Leading the world in the use of Fleet Video Telematics is North America, which has spending of $2.02 billion and a share of 42.1%, based on the Federal Motor Carrier Safety Administration Hours of Service Regulations and the maturity of the insurance reward structure with premium savings of 8-18%. Europe comes second with a share of 28.4% due to the European Union Digital Tachograph Regulations, which became mandatory in 2019 for all vehicles above 3.5 metric tonnes, along with penalties of €5,000 to €40,000, as well as the UK target of reducing heavy goods vehicle accidents by 40% until 2030.
Asia Pacific holds 19.8%, with China’s commercial fleet exceeding 14 million vehicles and India’s logistics expansion both cited as growth contributors, while basic video telematics in parts of Southeast Asia is being sold at $150 to $300 per vehicle. Latin America and the Middle East and Africa account for 6.2% and 3.5% respectively, still early in adoption but flagged as long-term growth regions.
Autonomous testing adds a new layer of demand
Autonomous vehicle development is emerging as a distinct pull on fleet video telematics software, layered on top of the conventional passenger-vehicle segment’s 22.8% share and 11.2% projected growth rate. Robotaxi and automated-driving test fleets require continuous multi-camera recording, synchronized radar, lidar and inertial logging, and rapid retrieval of edge-case footage, a workload considerably heavier than typical commercial fleet recording. That is prompting established safety-software providers to extend tools built for driver monitoring and incident detection, originally validated at accuracy rates of 92% to 96% against human review, toward tagging disengagements, near misses and unusual traffic scenarios in automated-driving datasets.
The trend is already visible commercially: Verne, Pony AI and Uber have announced plans to launch the first commercial robotaxi service in Europe, with public-road validation work under way ahead of a planned start in Zagreb. Industry analysts also flag the reverse risk, projecting that autonomous vehicle adoption reaching 8% to 12% of fleet penetration by 2033 could reduce the addressable base for traditional driver-behavior analytics by 15% to 25%, even as it opens a parallel demand line for high-bandwidth, multi-camera testing and validation software.
Regulatory developments
Oversight of automated driving has shifted materially in 2026. In June, the National Highway Traffic Safety Administration withdrew its proposed Automated Driving System-Equipped Vehicle Safety, Transparency and Evaluation Program, a voluntary framework that would have required extensive operational data reporting and independently validated safety cases, and proposed updates to Federal Motor Vehicle Safety Standard No. 135 to account for vehicles built without steering wheels or pedals.
In July, the NHTSA and the DOT issued the first ever commercial exemption for a robotaxi service, which included an additional condition for increased oversight to facilitate modification of any authorization based on the development of the related technology. Moreover, Congress is considering the passage of the SELF DRIVE Act of 2026 which would give NHTSA more statutory power over ADS design and performance standards.
Established compliance regimes continue to anchor conventional demand alongside this evolving automated-vehicle framework. The FMCSA’s Electronic Logging Device mandate, in force since December 2017, created the data foundation many fleets now pair with video evidence, while the EU’s tachograph and data-protection rules remain binding on commercial operators across the bloc.
Insurance and AI economics
Insurance remains one of the clearest financial arguments for adoption. Progressive’s commercial Fleet Video Telematics programme, covering more than 650,000 vehicles, has documented claim frequency reductions of 12% to 15% and generated more than $200 million in annual savings across its customer base. According to Lytx, the use of algorithms which learn from over 550 million hours of video data for fleet vehicles has led to a 48% decline in at-fault crashes and a decrease in claim frequency of 15% to 25% among insured fleets, while Hartford Steam Boiler has seen an 18% drop in liability claims for heavy vehicle operators who participate in coaching programs using video data.
Overall, in the industry, adoption leads to 10% to 18% fewer at-fault accidents, 12% to 25% fewer insurance claims, and 8% to 20% lower premiums after one year.
Competitive landscape
The supply continues to be fragmented, with some 20 to 30 mature vendors and 150 to 250 specialty vendors addressing niche applications. The market leader is Verizon Connect, with an estimated market share of 10 to 12% and 5 to 8 million connected vehicles, with the number two player being Geotab, with 9 to 11% of market share and 3 to 5 million connected vehicles, with a third of its revenue being from Europe, the Middle East, and Africa.
The third largest provider is the fastest growing among the large vendors, Samsara, with 6 to 8% market share and a post-listing valuation exceeding $7.5 billion in 2023. In total, the top three vendors have 28 to 32% market share of the total spend, while the next seven, which include Trimble, Lytx, Omnitracs, Teletrac Navman, Masternaut, Fleet Complete, and Mix Telematics, account for another 22 to 26%.
Outlook of Fleet Video Telematics
Economies in their nascent stages continue to be the biggest opportunity, with Fleet Video Telematics in these markets having a penetration rate between 3%-8% in comparison with 22%-28% penetration in North America and Europe. This is expected to result in an addition of between 450 to 650 million units over a period of eight years.
The expansion of such market segments will come hand in hand with reduction in software costs, with per-vehicle per month cost dropping from $50-$80 in 2022 to $20-$35 in 2030. For senior decision-makers, the combination of falling software prices, rising data volumes from both conventional fleets and autonomous test programmes, and a still-evolving regulatory environment for automated driving points toward software, rather than cameras, as the layer most likely to determine which providers lead the sector through 2033.